Turn coverage
links into
beautiful reports.
Boardroom-ready presentations in under 3 minutes.






 InstagramInstagram
To your client, the coverage report is the campaign.
PRCharter makes the deliverable your client sees as impressive as the work: a branded presentation built from your links, with expert enrichments to highlight the impact.
What you get with PRCharter
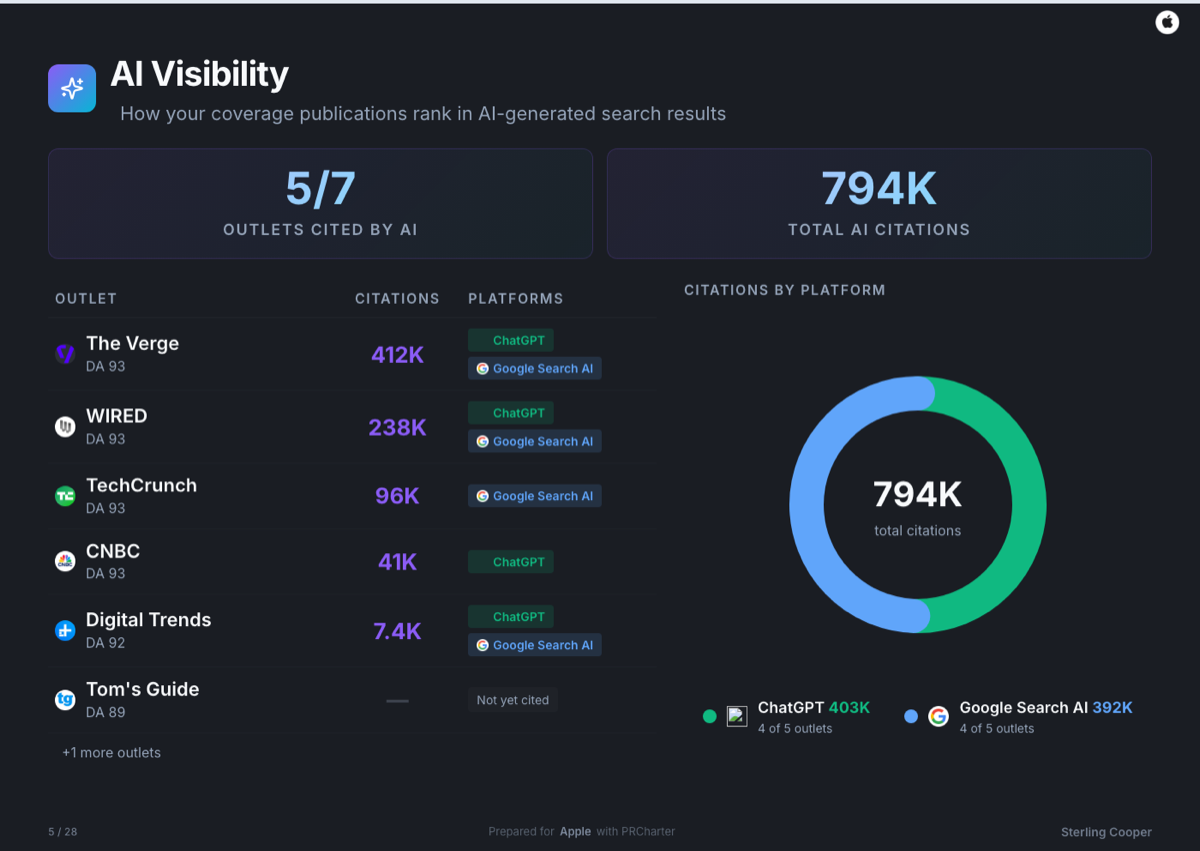
AI Discovery Analysis
We empower your team with a clear answer to the question: “How well does this coverage work for our AI visibility?” — PRCharter checks which publishers are cited by ChatGPT and Google's AI results, and puts the answer on a slide no other coverage report carries.
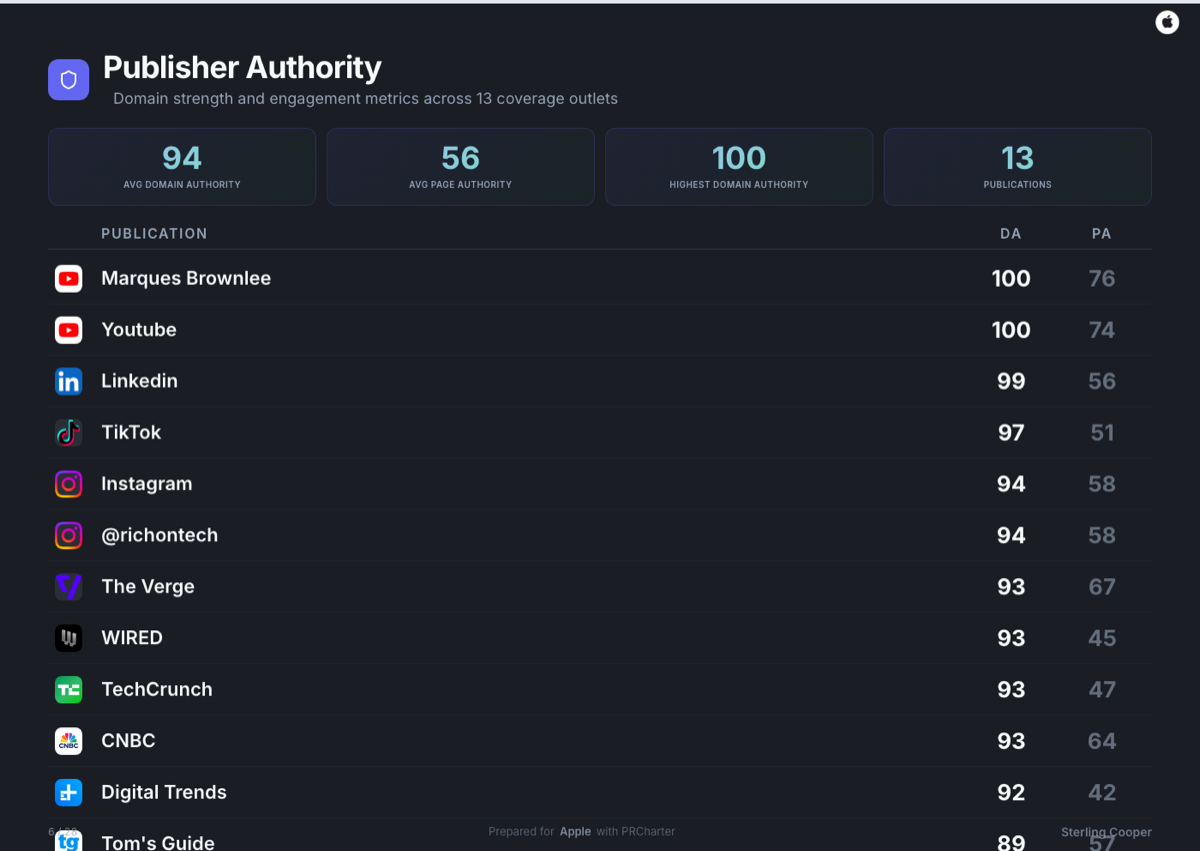
SEO & Web traffic metrics
Domain authority, estimated traffic and SEO link value on every placement — the numbers that turn coverage into next quarter's budget.
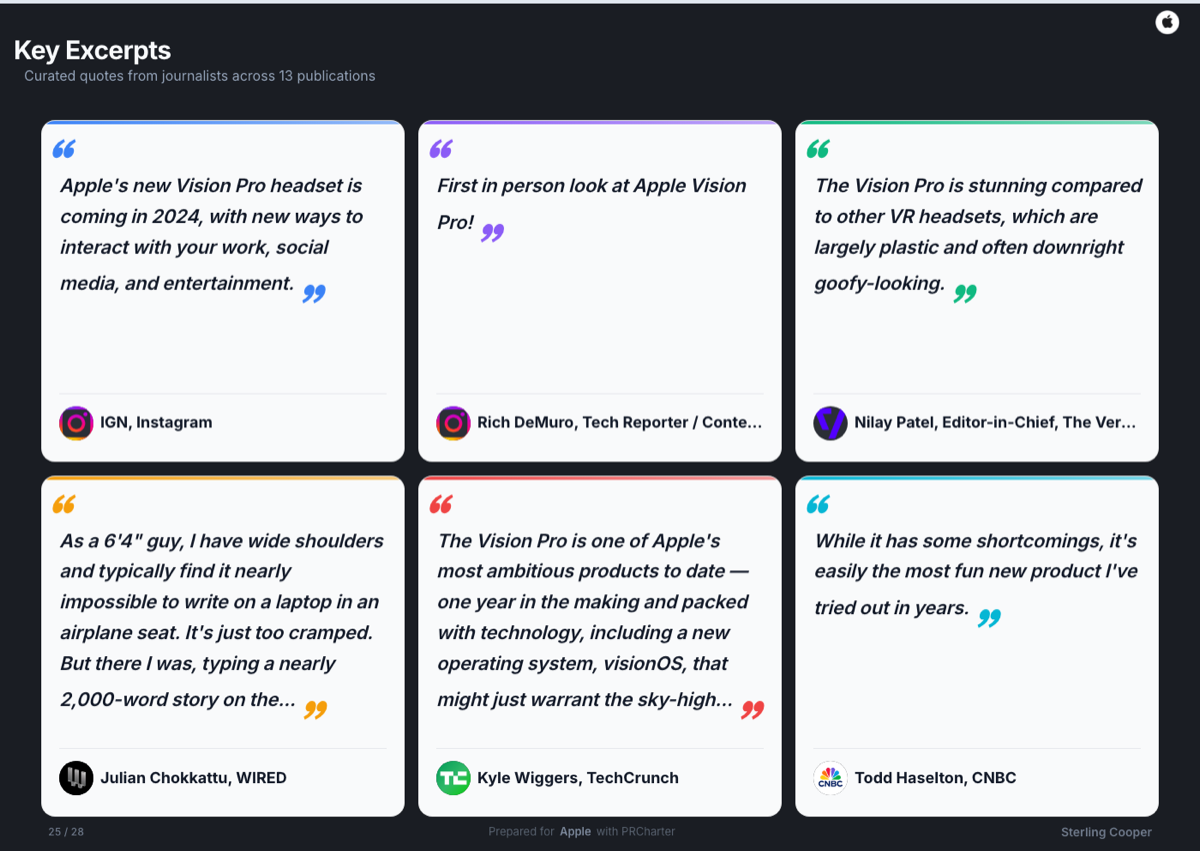
Best quote curation
The strongest brand mentions pulled from every article, curated and ready to headline slides.
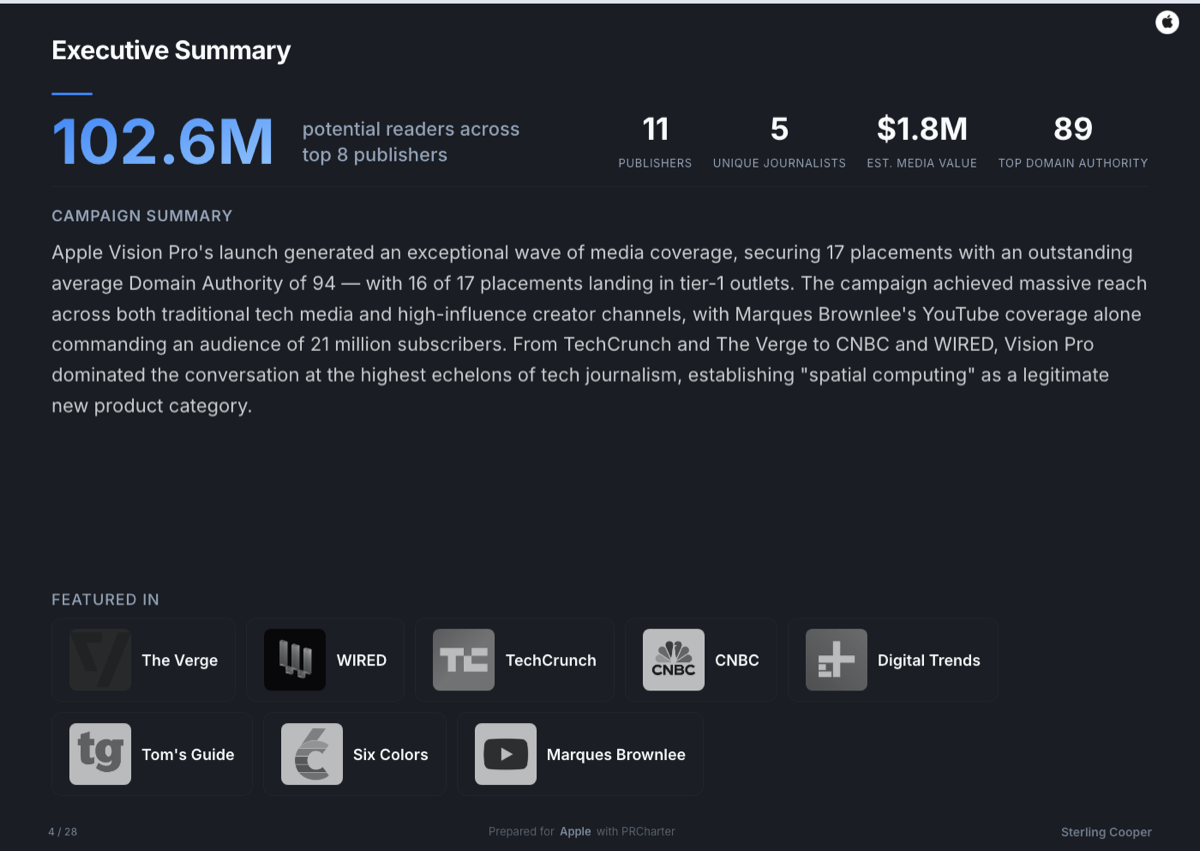
Executive summaries
The campaign story, drafted for you — a summary your client can forward straight upstairs.
Get notified when clients view your report
Know the moment your report is opened — follow up while it's warm.
Bespoke presentation designs for Enterprise agencies
Our art director and technical team install a bespoke theme for your agency — your reports, unmistakably yours.
The coverage report, reinvented
Before and after PRCharter
The old way
- ✕An evening lost in PowerPoint or Canva per report
- ✕Cropped, half-loaded screenshots — paywalls beat you
- ✕A flat PDF attachment nobody opens twice
- ✕Metrics pasted by hand, wrong by send time
- ✕Reports that undersell the work
With PRCharter
- ✓Minutes from links to a finished deck
- ✓Clean full-page captures, paywalls included
- ✓A live presentation your client clicks through — and a PDF when they ask
- ✓Quotes, sentiment, reach and SEO value extracted automatically
- ✓Your logo, your colors, on every slide
Under 3 minutes. No credit card.
Questions & Answers
How long does a report actually take?+
The first draft builds itself in under 3 minutes. Most users spend a few more polishing the slide order and cover before sending.
Does it work on paywalled articles?+
Yes — full-page screenshots are captured even behind most paywalls, so the clip your client sees looks like the real article, not a login wall.
What does my client receive?+
A link to a live, full-screen presentation under your branding — no account needed on their side. You can also export a PDF for the traditionalists.
How much does it cost?+
There's a free tier to try PRCharter on a real campaign. Paid plans start at $70/month and scale with your client count — see Pricing for the dial.
Can I try it without a call?+
Yes. Paste links above and build your first report free. The demo call exists for teams who want a guided tour, not as a gate.
Your coverage deserves a better report.
Build your first report free — or take the guided tour on a 30-minute call.